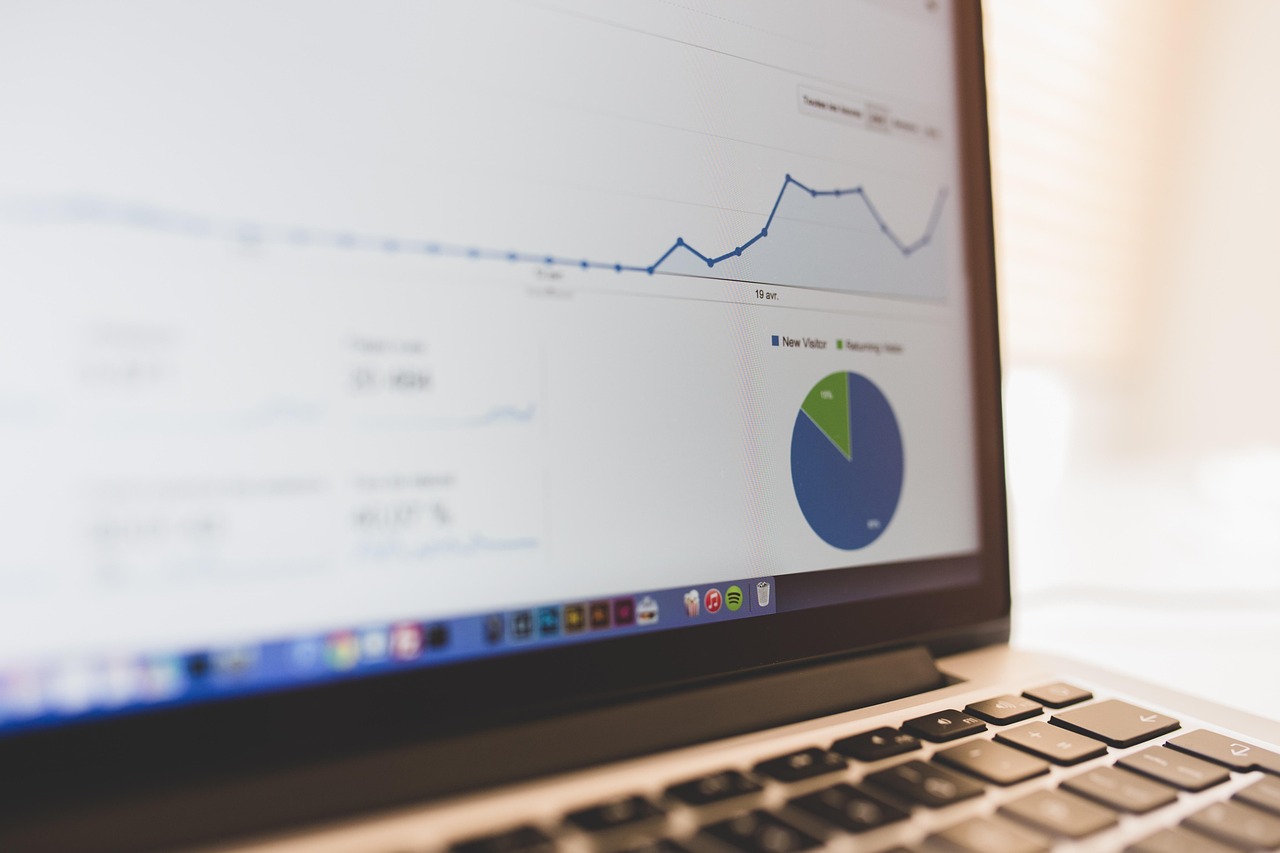
The Daily Dashboard, Data into Decisions
A snapshot of a presentation by Mapitso Mphahlele of Adonai Accountants and Tax Practitioners at the KLCBT Business Conference:
A daily dashboard is a visual summary of the most important business information that enables a CEO to monitor performance, identify risks, and make informed decisions every day:
Monitor business health daily, identify opportunities and risks early, track performance against targets and track profitability and cash flow.
Some key performance indicators that you can adopt in your daily dashboard are: Track revenue, profit margins and expenses; monitor inflow and outflow of cash as well as liquidity ratio indicators; measure sales volume and customer engagement; operational productivity and efficiency in processes and output; diligently maintain your compliance checklist and deadlines for submissions and finally keep your risk and mitigation register alive and up to date— What gets measured gets managed!
Create your own dashboard with at least five of the most important key indicators—there are many calculation tools and rations available, even if you did not study MBA or finances, learn online to get these tools to make your business grow and to keep it lean and flexible.
Mapitso’s presentation gives examples various Daily Dashboards: Financial, Cash Flow, Marketing Sales & Customers; Operations and Productivity, Compliance as well as the CEOs Decisions. Her suggestions are really practical and an excellent way to start building your own unique dashboard. Fix what needs fixing, build what needs building and cut what needs to be cut.